Supply > Demand = Lower Stock Prices Ahead
By John Del Vecchio and Brad Lamensdorf
It’s simple really. When supply exceeds demand, prices tend to head lower. Last week, The Chart of the Week highlighted Warren Buffet’s favorite market indicator. Valuations are stretched to say the least. Of course, what’s overvalued can become more overvalued before markets correct.
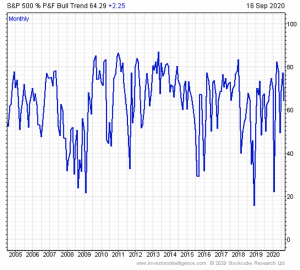
This week we look at price action. Specifically, the Bullish Percent on the S&P 500. The Bullish Percent Indicator measures the percentage of stocks in bullish trends using point and figure charting. Point and figure is a century old. The beauty of this method is that its simple to understand. Stocks are either in a bullish or bearish trend.
Furthermore, unlike the indexes which tend to be market-cap weighted, Bullish Percents use a “one stock, one vote” weighting method. Each stock is viewed the same. This can highlight pockets of strength, weakness, and most importantly, divergences in the market.
Look at the chart below.
Supply > Demand = Lower Stock Prices Ahead
There’s been a huge run in the S&P off the lows several months ago. That represented a period where stocks became deeply oversold and market sentiment was simply too negative.
We were very bullish near the lows.
Not anymore.
While the indexes surged, a lot of stocks simply ran out of breath recently. They couldn’t keep up. While technically the S&P 500 didn’t get so overbought as to register a sell signal, stocks sure did in the over-the-counter market.
Now prices are reversing.
More negative trends are starting to emerge.
What does this all mean? Well, risks are higher here. Yes, the market could bounce and rally from here. But the risks are all those gains, and then some, will disappear.
Markets tend to overshoot. In both directions.
There will be low risk opportunities to scoop up stocks in the future. Possibly the near future. But we have a way to go from here. Market sentiment is also too bullish to get aggressive buying stock here.
Contrarians will simply sit on their hands for now.
The Active Alts SentimenTrader Long / Short strategy uses numerous indicators to identify market extremes and adjust exposure accordingly for superior risk-adjusted returns. To learn more, visit activealts.com