Market Bounce Quickly Becomes Very Overbought
By John Del Vecchio and Brad Lamensdorf
Wow!
That was fast.
The September 29 Chart of the Week highlighted a very oversold market. The TIR Indicator had plummeted. Stocks were deeply oversold. It bottomed a few days before we published the chart, courtesy of Investor Intelligence.
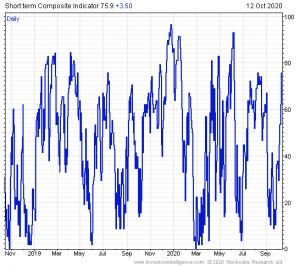
While the indicator is volatile and measures the short-term, it has swung very hard in the other direction.
Like a rubber band pulled in one direction, the market has snapped back. Now, risks are high.
High at a time when market valuations are as heady as any time in Warren Buffet’s 90-year lifetime. We showed that chart on the September 17th Chart of the Week.
High at a time when stocks are losing momentum even as the indexes have pushed higher. We showed that chart on the September 22nd Chart of the Week.
High at a time when dumb money is all bulled up and smart money is hiding in a foxhole, as seen in the October 9th Sentiment Update.
High at a time when small investors are buying call options hand over fist. And, paying huge premiums for the privilege to lose money. Levered lottery tickets on losing numbers.
That’s where we are today.
All that points to higher risk and lower returns.
The proprietary Active Alts SentimenTrader Exposure Gauge came into the year bearish, then turned bullish near the COVID pandemic freak out lows. The market has had an historic rally. Now is not the time to be greedy.
The Active Alts SentimenTrader Long / Short strategy uses numerous indicators to identify market extremes and adjust exposure accordingly for superior risk-adjusted returns. To learn more, visit activealts.com