Chart of the Week 05-07-2018
Should You Sell in May and Go Away?
By John Del Vecchio
There’s an old market saying to “sell in May and go away”. Over time, a heavy seasonal pattern of stronger stock price performance from the late fall to early spring has developed. But, just blindly following a Wall Street maxim can also be a good way to have money picked from your pocket.
It turns out that this old Wall Street maxim is right on the button. The chart below illustrates the performance between stock price performance from November – April (blue line) and May – October (red line).
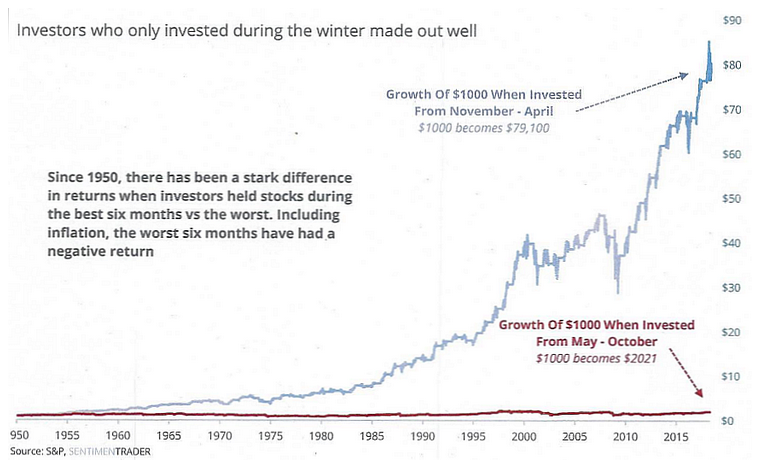
The difference is stark.
$1,000 invested from November – April returns $79,100 while $1,000 invested from May – October yielded just $2,201.
Obviously, we have just entered May so this seasonal pattern of lower stock prices is just under way. There’s no guarantee that this pattern will hold this year. However, it’s worth noting that we are living amongst one of the longest bull markets in history. Increasingly, market performance is being driven by just a handful of stocks such as Amazon.com, Netflix, Facebook, and Alphabet (Google). Meanwhile, below the surface of the indexes there’s plenty of weakness in individual stocks.
Given that the market is long in the tooth and divergences among stocks are forming, it may pay well to heed the advice to sell in May and go away. For a while at least.