Narrowing Market is a Red Flag
In recent weeks, we have warned that market breadth has deteriorated.
Poor breadth in the midst of a rising market is a red flag as fewer stocks are participating in the market rally.
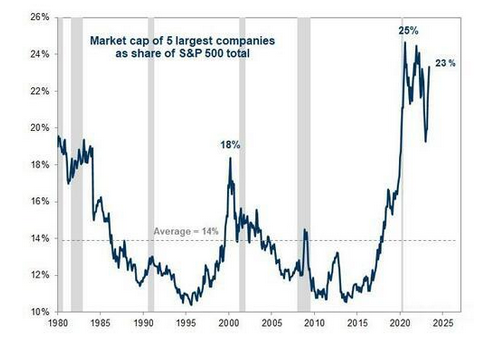
Dovetailing with the narrowing market breadth is the share of the biggest stocks in market-cap weighted in indexes.
The chart below shows the S&P 500’s top five stocks represent 23% of the index. That’s close to a 40-year high hit in 2020 (25%) and considerably higher than the 14% average and the 18% witnessed in the 2000 Bubble.
Generally after periods of concentration, the market reverts. Thus, one might expect big losses amongst the largest stocks in the indexes.
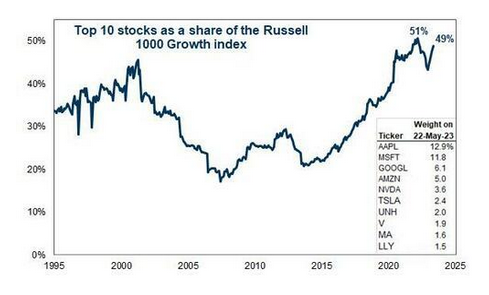
The scenario is even worse within the Russell 1000 Growth Index. Some of the same stocks that contribute to concentration in the S&P 500 further distort the RUT 1000 Growth Index.
As the chart below shows, the concentration among the top 10 stocks is 49%. That compares with a high of 51% since 1995.
Time to hedge?
To learn more about how these indicators can help manage risk in your portfolio, book a call with Brad.

DISCLOSURE: LAMENSDORF MARKET TIMING REPORT
Lamensdorf Market Timing Report is a publication intended to give analytical research to the investment community. Lamensdorf Market Timing Report is not rendering investment advice based on investment portfolios and is not registered as an investment advisor in any jurisdiction. Information included in this report is derived from many sources believed to be reliable but no representation is made that it is accurate or complete, or that errors, if discovered, will be corrected. The authors of this report have not audited the financial statements of the companies discussed and do not represent that they are serving as independent public accountants with respect to them. They have not audited the statements and therefore do not express an opinion on them. The authors have also not conducted a thorough review of the financial statements as defined by standards established by the AICPA.
This report is not intended, and shall not constitute, and nothing herein should be construed as, an offer to sell or a solicitation of an offer to buy any securities referred to in this report, or a “buy” or “sell” recommendation. Rather, this research is intended to identify issues portfolio managers should be aware of for them to assess their own opinion of positive or negative potential. The LMTR newsletter is NOT affiliated with any ETF’s. Active Alts is affiliated with Lamensdorf Market Timing Report. While LMTR uses charts from SentimenTrader, they do not have a financial arrangement with SentimenTrader Past performance is not indicative of future results.