Hindenburg Omen and Titanic Syndrome Could Signal Big Trouble for Stock Market
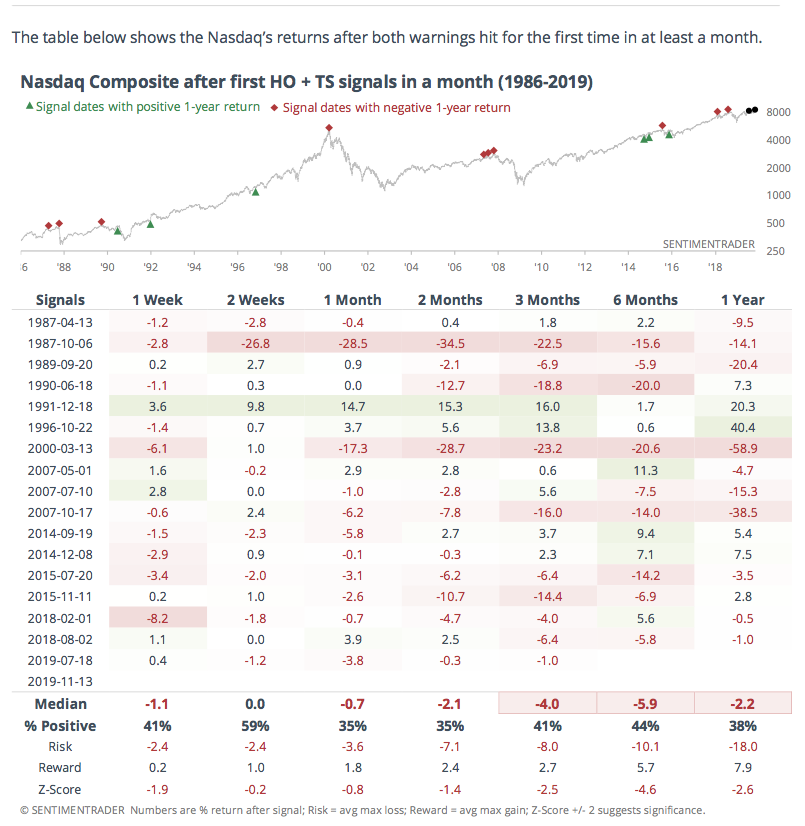
Hindenburg Omen and Titanic Syndrome Could Signal Big Trouble for Stock Market. We’re obviously not talking about the German airship that went down in flames in New Jersey nor the “unsinkable” British passenger liner that hit an iceberg and sank. What we re talking about is sets of conditions in the stock market that historically have been followed by big downturns, if not crashes. Known as the Hindenburg Omen and the Titanic Syndrome, both happened during recent trading sessions on the Nasdaq. As a result, showing great underlying market weakness despite record index highs. You’ll note in the chart below on Nasdaq performance since 1962 to 2019 big drops when the Hindenburg and Titanic kicked in (signified by the red dots).
As Jason Goepfert of Sentiment Trader explains it, basic guidelines of the Hindenburg are that (1) the market must be in an uptrend, (2) a large number of stocks be hitting 52-week highs and 52-week lows, and (3) show negatively diverging breadth momentum. The Titanic adds that the index has to have hit a high in the last seven trading sessions. This followed by more stocks hitting record lows than highs. To simplify this, both are trying to predict dangerous times ahead when an index is doing well. However, there is strife under the surface. Goepfert points out these conditions hit both the Nasdaq and the NYSE in late July. Just before the August downturn, but has not yet occurred on the NYSE. Nevertheless this is a clear warning sign of trouble ahead, particularly when combined with other signs of overall stock market weakness.