Bullishness Fades but Odds Favor a Bounce
By John Del Vecchio and Brad Lamensdorf
A little dip in the markets recently has led to a marked decline in the level of Investors
Intelligence advisors’ bullishness. Bulls have dropped to 53.9% down from 56.3% the
prior week. This marks the fifth week below 60% where sentiment was pinned for most
of the fall and early winter.
Importantly, the shift in the bullish sentiment has moved toward “correction” mode as
opposed to outright bearishness.
While the level of bullishness has subsided, it’s still too high. Our own indicators
suggest that we are moving toward an outright sell signal on the market, but we are not
there yet.
Based on current readings, we expect a bounce.
Even though the level of bulls has moved off its extreme readings, it’s still too high. That
said the odds favor a short-term market move higher. Below is the short-term composite
also courtesy of Inventors Intelligence that measures dozens of technical indicators.
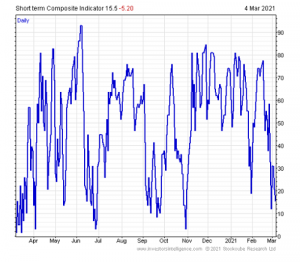
This composite indicator has fallen sharply in the past 10 days. Pressed nearly to the
floor, the market is due for a bounce based on this extreme move recently.
However, now is not the time to get complacent. The level of bulls will have to move
significantly lower and they will have to crawl over to the bear camp before a meaningful
bottom can be put in. Before then, there is likely to be aggressive selling and an
extreme oversold condition in the market. Then a favorable risk / reward scenario is
likely to present itself.
Active Alts uses dozens of indicators to monitor extremes and pounce on opportunities
with tremendous risk / reward ratios in the market. Book a call with Brad to learn how
these indicators can help you navigate the markets in 2021 and beyond.

General Disclaimer
Active Alts, Inc. (“Active Alts” or the “Manager”) is an investment adviser registered with the state of Connecticut. Active Alts manages the Active Alts SentimenTrader L/S Strategy and SentimenTrader serves as the research/index provider for the strategy. Registration with the state of Connecticut does not imply a certain level of skill or training.
The information set forth regarding securities and investment advice was obtained from sources which we believe reliable but we do not guarantee its accuracy or completeness. Neither the information nor any opinion expressed constitutes a solicitation by us of the purchase or sale of any securities. The performance quoted above represents past performance and current performance may be lower or higher than the performance date quoted. Past performance does not guarantee future results as investment returns may vary from time to time depending upon market conditions and the composition of the strategy.
SENTIMENTRADER DISCLAIMS ANY AND ALL EXPRESS OR IMPLIED WARRANTIES, INCLUDING, BUT NOT LIMITED TO, ANY WARRANTIES OF MERCHANTABILITY, SUITABILITY OR FITNESS FOR A PARTICULAR PURPOSE OR USE. Investors should consult their tax advisors before making investment decisions, as well as realize that past performance and results of the strategy are not a guarantee of future results. The Active Alts SentimenTrader L/S Strategy is not intended to be the primary basis for investment decisions and the usage of the strategy does not address the suitability of any particular investment for any particular investor.
The Standard & Poor’s 500 Index is provided for informational purposes only. Indices are not indicative of the strategy and may not be suitable for comparison purposes. Indices that may be shown do not reflect the deduction of advisory fees, commissions or other transaction charges.
Fees charged by the Firm are negotiable and may vary by client.
Before making an investment, you should consider your goals, objectives, time horizon and risk tolerance to be sure that this investment is suitable for you. There are no guarantees that the strategy will perform as it did in the past. You could lose money and you should not invest unless you can afford to lose some or all of your invested funds.
Calculation Disclaimer
Dividends are included in the performance results. The Manager have also calculated the net results by applying the highest management fee to be charged to advisory clients. Results will vary based on the amount of the fee applied. The results were also calculated by rebalancing the long and short portfolios on a weekly basis. The portfolio selection was and will be generated from the proprietary Active Alts stock selection process which is based on quantitative factors and mechanically driven. Commissions were added. No taxes were deducted; no borrowing costs were added; and no ex-dividend costs were included from the short portfolio.
Downside deviation is a measure of downside risk that focuses on returns that sell below a minimum threshold of a Minimal Acceptable Return (MAR).
Sharpe ratio is the average return earned in excess of the risk free rate per unit of volatility of risk.
Time to recovery is the duration of time it takes to restore the value lost.
Beta is a measure of a stock’s volatility in relation to the market. By definition, the market has a beta of 1.0, and individual stocks are ranked according to how much they deviate from the market. A stock that swings more than the market over time has a beta above 1.0.
Annualized volatility – Historic volatility measures a time series of past market prices. Implied volatility looks forward in time, being derived from the market price of a market-traded derivative (in particular, an option).
Max drawdown is an indicator of the risk of a portfolio chosen based on a certain strategy. It measures the largest single drop from peak to bottom in the value of a
portfolio (before a new peak is achieved).
(1) Indicators drive the exposure while a proprietary Long & Short portfolio are rebalanced monthly for the strategies equity drivers.
(2) Commissions were added to the exposure rebalance as well as the monthly stock rebalance.