Breadth Weakens, Tossing Up a Red Flag
By John Del Vecchio and Brad Lamensdorf
One of the defining characteristics of the market advance since the COIVD lows over a year ago has been broad participation from many sectors of the equity markets.
While most stocks have followed the major market trends, there are signs that this massive bullish move may be running out of steam.
The chart below, courtesy of SentimenTrader.com illustrates what has happened when the S&P 500 continues to regularly make new highs, but the majority of stocks start to trade below their 50-day moving average.
One such signal just occurred for only the seventh time since the 1920’s.
The results are sobering.
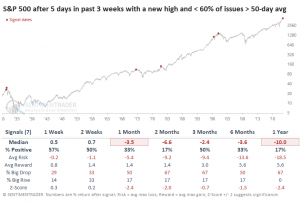
As the chart shows, when this rare signal occurs, losses pile up. Over multiple periods from a month to a year, the historical performance is down. The one-year historical performance shows a decline of 10%. What’s more, the performance has been positive only 17% of the time.
The average maximum loss is 18.5% compared with an average maximum gain of 5.6%. Poor risk / reward ratios don’t get much worse than that.
In fact, in each of the periods, the performance has been positive 50% of the time or less.
It’s time to start rounding up the hedges!
To learn more about how these indicators can help manage risk in your portfolio, book a call with Brad.

DISCLOSURE: LAMENSDORF MARKET TIMING REPORT
Lamensdorf Market Timing Report is a publication intended to give analytical research to the investment community. Lamensdorf Market Timing Report is not rendering investment advice based on investment portfolios and is not registered as an investment advisor in any jurisdiction. Information included in this report is derived from many sources believed to be reliable but no representation is made that it is accurate or complete, or that errors, if discovered, will be corrected. The authors of this report have not audited the financial statements of the companies discussed and do not represent that they are serving as independent public accountants with respect to them. They have not audited the statements and therefore do not express an opinion on them. The authors have also not conducted a thorough review of the financial statements as defined by standards established by the AICPA.
This report is not intended, and shall not constitute, and nothing herein should be construed as, an offer to sell or a solicitation of an offer to buy any securities referred to in this report, or a “buy” or “sell” recommendation. Rather, this research is intended to identify issues portfolio managers should be aware of for them to assess their own opinion of positive or negative potential. The LMTR newsletter is NOT affiliated with any ETF’s. Active Alts is affiliated with Lamensdorf Market Timing Report. While LMTR uses charts from SentimenTrader, they do not have a financial arrangement with SentimenTrader Past performance is not indicative of future results.